Contact us


3 Approaches to Quantifying US Partisanship in News Sources
Our datasets and tools are used to study a wide variety of topics across a global set of media ecosystems, but Media Cloud's history is rooted in studying partisanship in US-consumed media. 10+ years on, we continue to focus on innovating new approaches to studying politics in our home country's online media ecosystem. In particular, there have been numerous attempts to place media sources on a partisan axis, from liberal (left) to conservative (right); media researchers commonly use social media sharing patterns to discern partisanship based on audience readership and sharing patterns. This blog post summarizes three such approaches that we have built media collections to support. Each employs a different methodology and could be useful for you based on the assumptions, goals, and approach of your research.
Berkman Klein 2016 Partisanship
Studying media during the 2016 election, our Berkman Klein team members found strong evidence of asymmetrical polarization - far more sources on the far right than on the far left. To support the research in their lauded Network Propaganda book they developed a novel twitter-based methodology for quantifying partisanship of media sources.
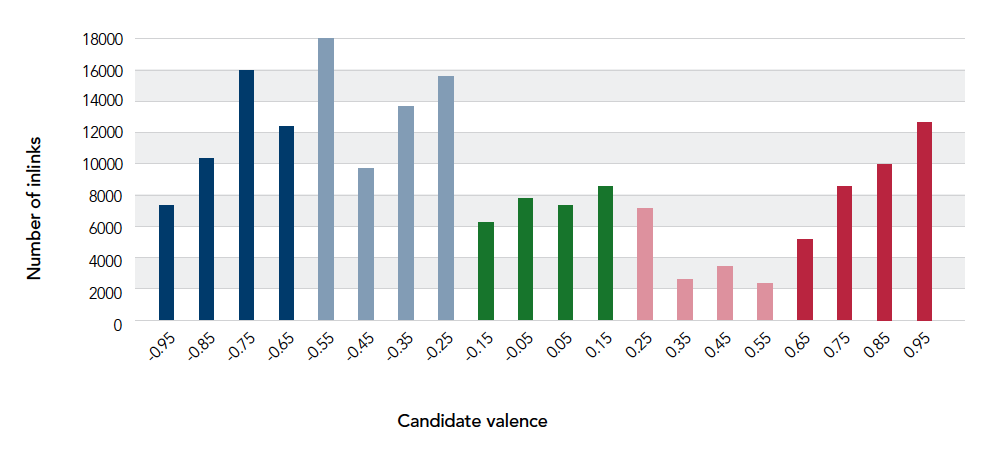
The 2016 media landscape was distinctly asymmetric. Source
Their process began by looking at a large set of followers of Trump and Clinton (the 2016 US presidential candidates) on Twitter and collected media links that these followers shared. For each media source (ie. domain) they then computed a score based on the relative amount of times each domain was shared by each group. If half the shares of domain1 were from Trump followers and half from Clinton followers, the domain was scored as a 0. If the vast majority of shares of domain2 were from Clinton followers, the domain was scored as -1. This score, between -1 and 1, was used to divide the list of most shared media sources into quintiles. Note that this list was not filtered for domains that focus on news, nor was it limited to just US-based sources. These collections have low certainty for individual members and should be used for aggregate analysis between quintiles, rather than individual analysis of media sources.
You can find these 2016 twitter-based partisanship quintiles in our system here:
- Tweeted Mostly by Clinton Followers 2016
- Tweeted Somewhat More by Clinton Followers 2016
- Tweeted Evenly by Trump/Clinton Followers 2016
- Tweeted Somewhat More by Trump Followers 2016
- Tweeted Mostly by Trump Followers 2016
Robertson 2018 Partisanship
Our Northeastern colleagues at the Lazer Lab took a different approach to assessing partisanship based on Twitter users. Their 2018 IW3CW paper by, Auditing the Personalization and Composition of Politically-Related Search Engine Results Pages (Robertson, Lazer, and Wilson), documents how they created a pool of around 500,000 Twitter users and connected them to their voter registration information (Republican or Democrat). They then took a similar approach to associated domains with users that shared links, combined that with the voter registration information, and computed a bias score between -1 and 1 based on the relative amount of links shared by those two groups. We did significant post-processing to filter those domains for often-tweeted, US-based, news sites via a number of methods and then a manual review (citation coming soon). With this smaller list of domains we created collections taking a similar approach of splitting them into quintiles.
You can find these 2018 twitter-voting-panel partisanship quintiles in our system here:
- Tweeted Mostly by Democrat Voters 2018
- Tweeted Somewhat More by Democrat Voters 2018
- Tweeted Evenly by Republican/Democrat Voters 2018
- Tweeted Somewhat More by Republican Voters 2018
- Tweeted Mostly by Republican Voters 2018
Berkman Klein 2019 Partisanship
To support their continued work on understanding the shifting landscape of news sources in the US, our Berkman Klein colleagues launched a new effort in 2019. To estimate media ideology scores, they calculated the relative position on the political spectrum of approximately 15,000 Twitter users that were active between January 2019 and June 2019 using an estimation process based on emIRT. This estimation technique produces a continuum of ideology scores but does not generate points of reference to help guide the drawing of boundaries between the left, center, and right. To estimate a center point in the distribution, they divided users into two groups, right of center and left of center, based on a center point derived from the intersection of users that self-identify in their profile as being either liberal or Democrat on one side and conservative or Republican on the other. Media sources are then tabulated based on the relative sharing of media sources by users on the right compared to users on the left using a -1.0 to 1.0 scale. The center point, 0.0, denotes an equal share of users on both sides sharing a media source in a month. Note - these are not filtered for US-based sources nor for news-only sources. Read more details and download scores on the Berkman Klein Public Discourse in the U.S. 2020 Election: Resources & Data webpage.
You can find these 2019 twitter-follower-based partisanship quintiles in our system here:
- Tweeted Mostly by Followers of Liberal Politicians 2019
- Tweeted Somewhat More by Followers of Liberal Politicians 2019
- Tweeted Evenly by Followers of Conservative & Liberal Politicians 2019
- Tweeted Somewhat More by Followers of Conservative Politicians 2019
- Tweeted Mostly by Followers of Conservative Politicians 2019
Next Steps
These 3 approaches all differ, but hopefully this blog post and the citations document them well enough for you to choose whether they fit your research or not. As you will note, we've tried to name the collections based on the methodology employed; while verbose we hope it is more descriptive than a name like "US Center 2019". We will continue to integrate more approaches to quantifying partisanship in US news sources, so please contact us if you have a collection you'd like to see created. Also remember that, like many of these approaches, these collections are meant to be used in aggregate and they don't claim to describe what "center" might really mean, nor equate further "right" sources with further "left" sources on some axis of partisanship. Those are human concepts that require more rigorous qualitative work. These collections are quantitatively derived classifications to support comparative analysis in aggregate. In that vein, we hope you find them helpful!

